Where to Invest?
Here is a table giving some view on the investor market in Las Vegas
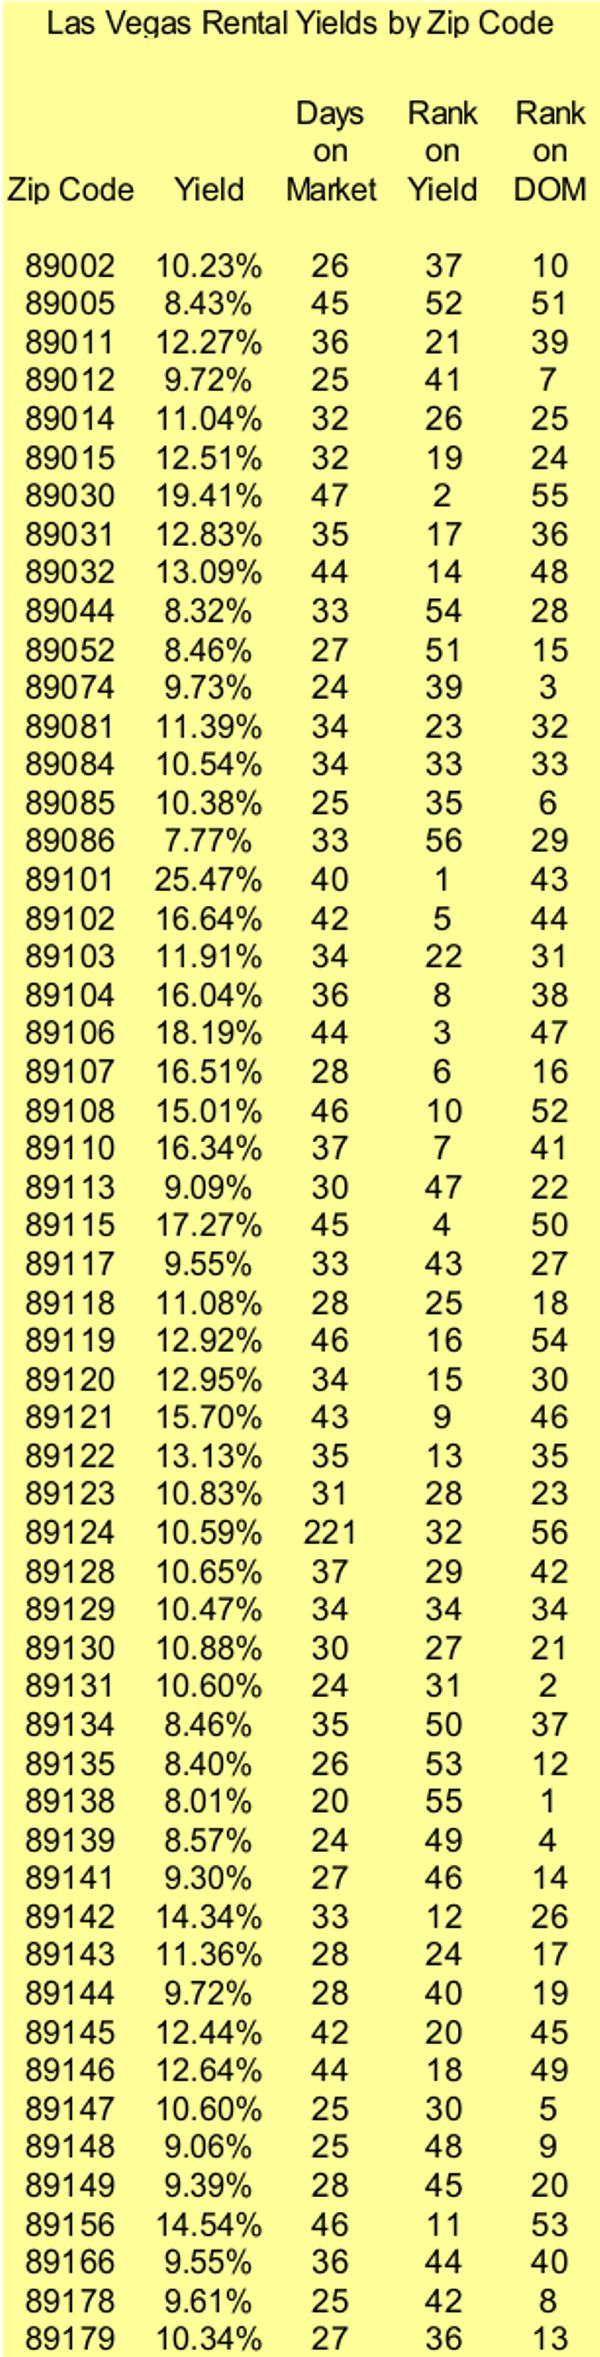
Yield in this table is the annual median rent in a zip code divided by the price of a 3/2 SFR. The real return on one of these places is likely half or less the listed yield. The yield ignores taxes, insurance, HOA fees and reserves.
Days on the Market (DOM) is also provided as a surrogate for how hard it will be to rent the place. Note that days on the market is listed for those that have rented. Thus it is a better number than the reality. As an estimate presume that a 25 day DOM will rent in less than 30 days...a 45 day DOM more like 90.
The strip zips are not included. They simple are a different animal and have to be approached by themselves.
The zips for yield
If we sort out the top 20 for yield we get the following table...
| Las Vegas Rental Yields by Zip Code | ||||
| Zip Code | Yield | Days on Market | Rank on Yield | Rank on DOM |
| 89101 | 25.47% | 40 | 1 | 43 |
| 89030 | 19.41% | 47 | 2 | 55 |
| 89106 | 18.19% | 44 | 3 | 47 |
| 89115 | 17.27% | 45 | 4 | 50 |
| 89102 | 16.64% | 42 | 5 | 44 |
| 89107 | 16.51% | 28 | 6 | 16 |
| 89110 | 16.34% | 37 | 7 | 41 |
| 89104 | 16.04% | 36 | 8 | 38 |
| 89121 | 15.70% | 43 | 9 | 46 |
| 89108 | 15.01% | 46 | 10 | 52 |
| 89156 | 14.54% | 46 | 11 | 53 |
| 89142 | 14.34% | 33 | 12 | 26 |
| 89122 | 13.13% | 35 | 13 | 35 |
| 89032 | 13.09% | 44 | 14 | 48 |
| 89120 | 12.95% | 34 | 15 | 30 |
| 89119 | 12.92% | 46 | 16 | 54 |
| 89031 | 12.83% | 35 | 17 | 36 |
| 89146 | 12.64% | 44 | 18 | 49 |
| 89015 | 12.51% | 32 | 19 | 24 |
| 89145 | 12.44% | 42 | 20 | 45 |
See a pattern forming? You get the strong yields on the places that rent with difficulty.. These in general are the central core zips. Older and often majority rentals. Mostly weaker schools. Good yields buty nobody wants to live there.
There is an exception. 89107, which is the central west corridor along Charleston and 95 appears both high yield and reasonably rentable.
The Zips to Rent Easily.
Here is the top 20 from the table in order of DOM.
| Las Vegas Rental Yields by Zip Code | ||||
| Zip Code | Yield | Days on Market | Rank on Yield | Rank on DOM |
| 89138 | 8.01% | 20 | 55 | 1 |
| 89131 | 10.60% | 24 | 31 | 2 |
| 89074 | 9.73% | 24 | 39 | 3 |
| 89139 | 8.57% | 24 | 49 | 4 |
| 89147 | 10.60% | 25 | 30 | 5 |
| 89085 | 10.38% | 25 | 35 | 6 |
| 89012 | 9.72% | 25 | 41 | 7 |
| 89178 | 9.61% | 25 | 42 | 8 |
| 89148 | 9.06% | 25 | 48 | 9 |
| 89002 | 10.23% | 26 | 37 | 10 |
| 89183 | 9.99% | 26 | 38 | 11 |
| 89135 | 8.40% | 26 | 53 | 12 |
| 89179 | 10.34% | 27 | 36 | 13 |
| 89141 | 9.30% | 27 | 46 | 14 |
| 89052 | 8.46% | 27 | 51 | 15 |
| 89107 | 16.51% | 28 | 6 | 16 |
| 89143 | 11.36% | 28 | 24 | 17 |
| 89118 | 11.08% | 28 | 25 | 18 |
| 89144 | 9.72% | 28 | 40 | 19 |
| 89149 | 9.39% | 28 | 45 | 20 |
Now we find all the outlying tracts. The Summerlins and Green Valley Ranch. We also find relatively weak yields. As expected the Northwest provides and interesting tradeoff with reasonable rental ease and yields highest of the easy rentals.
Again 89107 is the exception and worth looking at further.